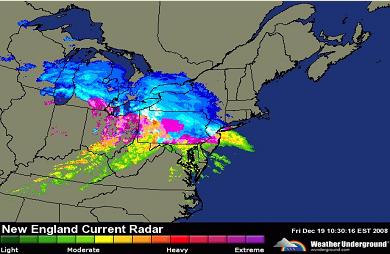
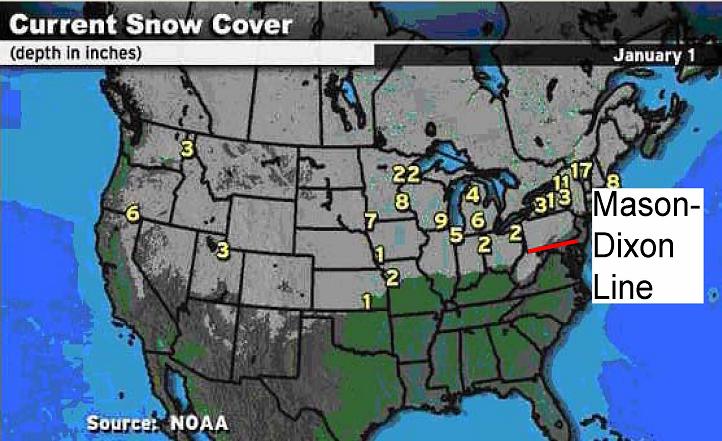
George Washington built the Mason-Dixon Line in 1763 for the purpose of keeping winter in Pennsylvania, where it belongs. It may be old and it leaks a bit these days, but it still does a great job most of the time as shown in these pictures from the US Weather Service. Of course, West Virginia is often an exception, but that can't be a surprise to anybody.
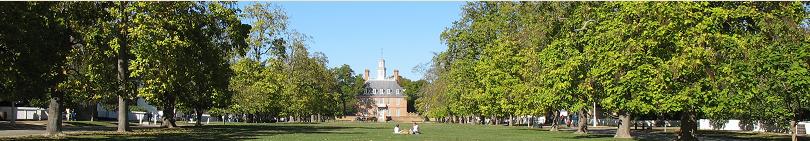
Williamsburg
Heating and cooling seasons
The evening weather reports on TV news frequently talk about things being colder North and West of Eastern US cities. Williamsburg's secret is being South and East of those places.
Data from the National Oceanic and Atmospheric Administration provide a quantitative way to look at this. Heating and cooling seasons are measured in degree-days, calculated by adding up the daily differences between the daily outdoor temperatures and a desired indoor temperature. So places with colder temperatures over more days have more degree-days in the heating season. Here are the numbers for Williamsburg and many other cities around the United States.
Note that Williamsburg's weather is more like Atlanta than it is like Washington DC, even though Washington is only 150 miles away. You could say that Williamsburg's climate is half way between Birmingham and Charlottesville, but much more conveniently located.
The Southern Living Garden Book places Williamsburg in the same climate zone as Raleigh, Atlanta, and Birmingham.
Data source: NOAA, Annual Degree Days to Selected Bases, 1971-2000
CLIMATOGRAPHY OF THE UNITED STATES NO. 81, Supplement No. 2